The downward spiral for journals continues. Is anyone surprised? Larry Dobrow on how the fundamental shift to digital continued to affect professional media last year, including the full-year numbers by advertisers and brands
In 2013, ad spending in medical journals continued its downward spiral. According to Kantar Media, journals shed 4,252.3 pages in 2013, down to 95,790.3 from 100,042.6 in 2012 (and, for the record, 121,096.4 in 2011). That represented a 4.3% year-on-year decline, roughly matched by the 3.1% drop in ad revenue (to $595.8 million, from $614.8 million in 2012).
And nobody cares.
Okay, that might be just a bit of an overstatement, and when we say “just a bit of an overstatement” what we really mean is “a clear overstatement, bordering on an irresponsible and transparently provocative one.” Most publishers, one presumes, wouldn’t mind at all if pharma ad spending reversed its recent downward course and started to soar like a majestic freedom-loving eagle once again. But as digital offerings have continued to expand in both their scope and ambition, the biannual release of journal ad data clearly isn’t ruining as many afternoons as it once did.
“This year, the print market was only down three or four percent, and I don’t think anyone sees it getting any better in the future,” says Luis Portero, Elsevier’s VP of commercial sales, pharma solutions business. “That said, what you’re losing in print, you should be making up in digital products, depending on how [adept] your company is in developing those solutions.” Paul Walsh, founder of Walsh Medical Media, puts it more succinctly: “The train has left the station. The fundamental shift to digital—it’s happened.”
While digital solutions are eminently trackable—and thus huge favorites of the analytics wonks flexing more decision-making muscle than ever before—nobody is tracking and reporting on them all, at least not the way Kantar tracks journal advertising.
“When you look at the data points, you have to remember that they’re not taking into consideration where the other dollars are going—whether to digital or conferences or wherever. The easy headline is ‘professional ad spending down,’ but when you peel away at the onion, there’s a lot more going on,” says Matt McNally, president of Publicis Health Media.
Publishers
Don’t buy it? Ask a publisher, even one who has absorbed his or her share of body blows over the past couple of years. To a person, publishers say that they’re satisfied with the year that has just gone into the books and are optimistic about what lies ahead. While publishers are no strangers to finely calibrated spin, they generally don’t throw around platitudes for the sake of throwing around platitudes.
MOST ADVERTISED CATEGORY

As in 2012, antineoplastic agents were 2013’s most advertised category, with a 14.1% spending bump—from $42.9 million in 2012 to just under $49 million in 2013. Next were oral anticoagulants (up 30%, from $21.2 million to $27.6 million) and oral diabetes drugs (up 204.6%, from $6.2 million to $19 million). The Top 25 categories with the biggest drops vs. the year-ago period: SSRI/SNRI products (down 81%) and diabetes insulin (down 32%).
“The beginning of the year was a little slow, but as it went on it really picked up. At the end of the year, the whole market rose a little bit—all publishers did well the last four or five months,” says Art Wilschek, executive director of global sales for the New England Journal of Medicine. Asked why the year played out in such a manner, Wilschek doesn’t yap about the FDA or patent cliffs or any such stuff. Instead, he quips, “It’s partly strategy, partly luck. Sometimes it just works out that way.”
While the numbers don’t match the general level of sunniness, 14 of the top 25 medical/surgical publications in overall ad pages and 14 of the top 25 publications in overall ad revenue enjoyed year-on-year increases. Granted, after the steep drops between 2011 to 2012, many of these jumps only represent a small rebound. But hey, it’s better to be up than down.
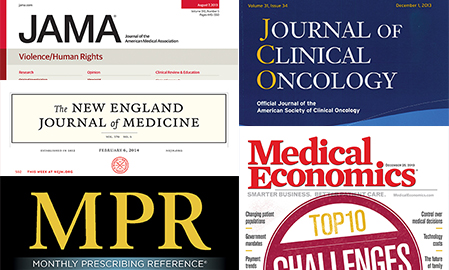
Wilschek’s NEJM (37% jump, to 2,695 in 2013 from 1,963 in 2012) reclaimed the year-end ad-page top slot from the Journal of Clinical Oncology (a 10% increase, to 2,291 pages from 2,083). And in terms of advertising revenue, Journal of the American Medical Association (a 38% increase, to $17.1 million from $12.4 million) overtook NEJM (an 18.2% increase, to $15.2 million from $12.9 million) to return to the top spot.
The most impressive gains in the top 10 were enjoyed by oncology publication The ASCO Post, which is now the third-ranked journal in ad pages and the seventh-ranked journal in ad dollars. The publication has more than tripled its ad-page count (472 in 2011 to 1,507 in 2013) and ad revenue ($2.5 million to $8.4 million) during the last two years.
MOST ADVERTISED BRAND

Janssen’s diabetes drug Invokana wasn’t advertised in 2012, since it hadn’t passed FDA muster. Once it did, in March, the company spent $15.9 million advertising it, making it 2013’s most advertised brand. The leader in 2012, Janssen’s Xarelto, was next, with spending of $13.4 million (up 13.7% over the year-ago period). Of the Top 100 products, BMS’s Eliquis tablets saw the biggest jump: from $5,000 in 2012 to almost $4.1 million in 2013, a 78,277% spike.
Some of the most interesting success stories can be found among smaller, niche journals. Take Walsh and his company’s flagship title, Clinical Schizophrenia & Related Psychoses, which was up 41% in ad pages and 36% in ad revenue in 2013. By narrowing the range of editorial content (read: nothing remotely off-topic) and limiting the number of advertisers in each issue (no more than eight ads total), the journal has eliminated the clutter that abounds in bigger, broader books.
“We are very, very niche, and for in-depth clinical niche content, there’s still a big role for print publications,” Walsh says. At the same time, he adds, those niches are no place for anyone with a weak stomach. “When a new drug is approved in the area, we throw a big party. But if a drug goes off patent, you take a hit. We are relying on a finite number of drugs.”
Companies/Brand
For all of the talk about how pharma marketers had shed their historical conservative nature in previous years, true change didn’t really make its presence felt until 2013. The year saw more companies that were willing to take some risks—not to engage in the bold, bizarre, viral-minded programs that were favored by some consumer brands, but perhaps to move just a few steps outside their comfort zones.
“I think [pharma companies] are getting more comfortable trying new things that are already being done quite frequently on the consumer side,” says Nicole Woodland-De Van, SVP, buying services & deliverables at Compas. “Not that they’re running out and doing wild and crazy stunts, but they’re getting a little bolder and more creative in how they try to reach the target audience.” One potential reason for this change in strategy, according to Woodland-De Van: more and more pharma-brand team members have a consumer background.
SEEN ON THE MOST SITES

On the web sites monitored and analyzed by Kantar Media’s Evaliant tool, Janssen’s Xarelto topped the list of online brands as ranked by frequency of ad occurrences. Ads for Xarelto represented 4.65% of all occurrences, topping Janssen’s Invokana (3.94%) and Eisai’sweight-loss drug Belviq (3.78%). Invokana was seen on the greatest number of web sites, however: 40, compared with 39 for Belviq and 38 for Xarelto.
Among the top 10 advertisers in medical journals, it was a study in extremes. Johnson & Johnson Corporate nearly doubled its print ad expenditures, going from $21.8 million in 2012 to $40.2 million in 2013 (84.2% growth); Celgene did the same, raising its spending from $2.8 million to $6.6 million (135%). On the other hand, 2012’s top advertiser, Forest Labs, slashed spending 55%, from $33.7 million to $15.2 million.
On the brand side, it was all about the new diabetes drug Invokana. Following Invokana’s approval by the FDA in late March, J&J flooded publications and websites alike with ads, ultimately spending just a touch under $16 million in medical journals alone.
What’s Next
Heading into 2013, most of the peer-into-the-crystal-ball predictions were cautious in nature and not particularly memorable: continued big things in oncology, more dollars targeted toward nurses, PAs and the like, etc. Five weeks into 2014, however, pundits have big ideas and expectations to match.
“You’ll see big uptake in video content, a much better use of sight, sound and motion to convey messages,” McNally predicts. “As cliché as it sounds, physicians are consumers. They expect a consumer-level experience.” Woodland-De Van agrees: “You’re going to see [pharma] clients keep bringing those consumer behaviors and insights over to the digital side.”
As for Portero, he predicts a comparable 5%-10% drop in print advertising revenue—but he also expects that many publishers will more than compensate for that loss with their digital programs and products. His advice to his publishing peers: don’t skimp on the content.
“Don’t create content just to get advertising. Create content because you see a need, because people want it. That way, if a big meteorite comes down and kills advertising, you could still exist,” he says.
From the March 01, 2014 Issue of MM+M - Medical Marketing and Media